Memory leaks can silently crash your web app or cause it to slow down over time. Yet, many JavaScript developers don’t think about memory management until it becomes a problem.
In this article, we’ll uncover:
- How memory management works in JavaScript
- What the garbage collector actually does
- Common causes of memory leaks
- How to detect and prevent them
- Real code examples to illustrate good vs bad practices
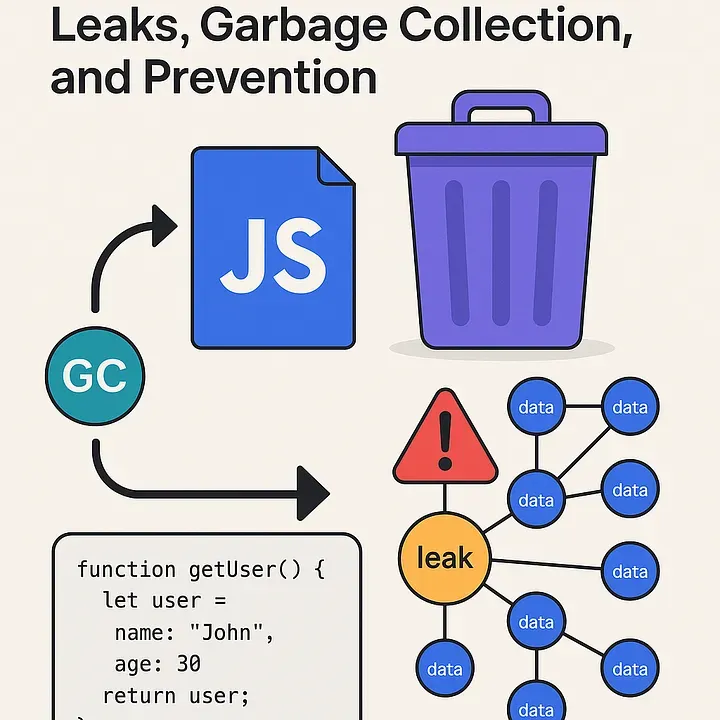
🗂️ What Is Memory Management?
Memory management is the process of allocating, using, and releasing memory in your application.
JavaScript being a garbage-collected language handles most of the memory work for you. But this doesn’t mean it’s immune to memory issues. In fact, memory leaks often arise not because of how memory is allocated, but because the program holds onto memory it no longer needs.
🧹 The Garbage Collector (GC)
🔁 How GC Works in JavaScript JavaScript engines like V8 (used in Chrome and Node.js) use a garbage collector to automatically free up memory that is no longer “reachable”. Here’s a simplified explanation:
- Memory is allocated when you create variables, objects, functions, etc.
- GC constantly tracks which parts of memory are still reachable.
- If a variable/object cannot be accessed directly or indirectly from the global scope or current stack, it’s considered garbage and will be cleaned up.
function getUser() {
function getUser() {
  let user = {
    name: "John",
    age: 30
  };
  return user;
}

const userData = getUser();
But once this example userData goes out of scope (or is set to null), and nothing references that object, it becomes eligible for garbage collection.
🧨 Common Causes of Memory Leaks
- Uncleared Timers and Intervals
- Detached DOM Nodes
- Closures Holding References
- Global Variables
- Event Listeners Not Removed
🛠️ Tools to Detect Memory Leaks
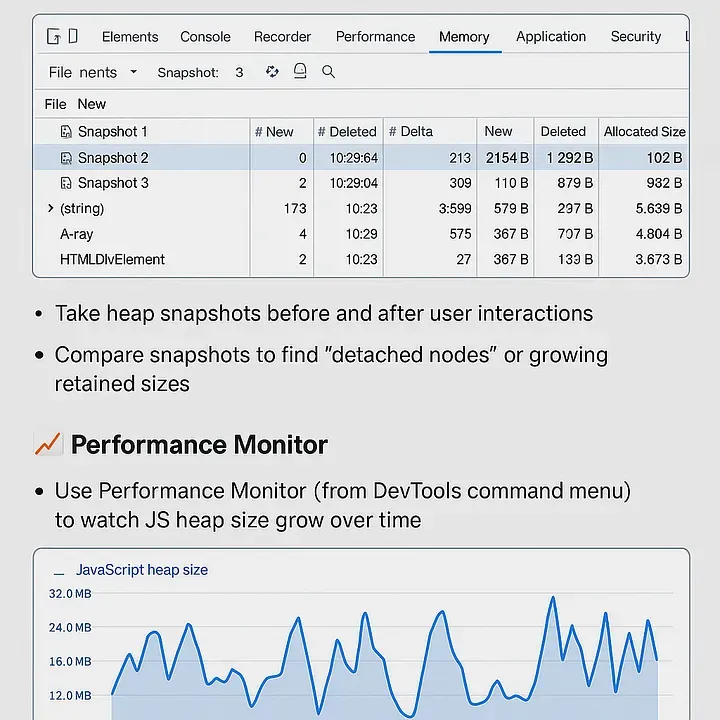
🔍 Chrome DevTools Performance & Memory Tabs
- Open DevTools → Memory tab
- Take heap snapshots before and after user interactions
- Compare snapshots to find “detached nodes” or growing retained sizes
📈 Performance Monitor Use Performance Monitor (from DevTools command menu) to watch JS heap size grow over time.
✅ Best Practices to Prevent Leaks
- Always clear intervals, timeouts, and event listeners
- Use WeakMap or **WeakSet ** for temporary object-keyed data (they don’t prevent GC)
- Avoid long-lived closures unless necessary
- Nullify references when you’re done using large structures
- Use tools like eslint-plugin-no-leaks for static detection
Last Example: WeakMap vs Map Example
let obj = { name: "John" };


let map = new Map();
map.set(obj, "data");

let weakMap = new WeakMap();
weakMap.set(obj, "data");

obj = null;
- map still holds obj as key => memory not freed
- weakMap allows obj to be GC’d automatically
🧾 Final Thoughts
JavaScript does handle memory for you, but you are still responsible for writing code that plays nicely with the garbage collector. Memory leaks don’t usually crash your app immediately they silently degrade performance over time.
Next time your app feels slower after long usage don’t blame the browser. Blame your orphaned closures and forgotten timers.